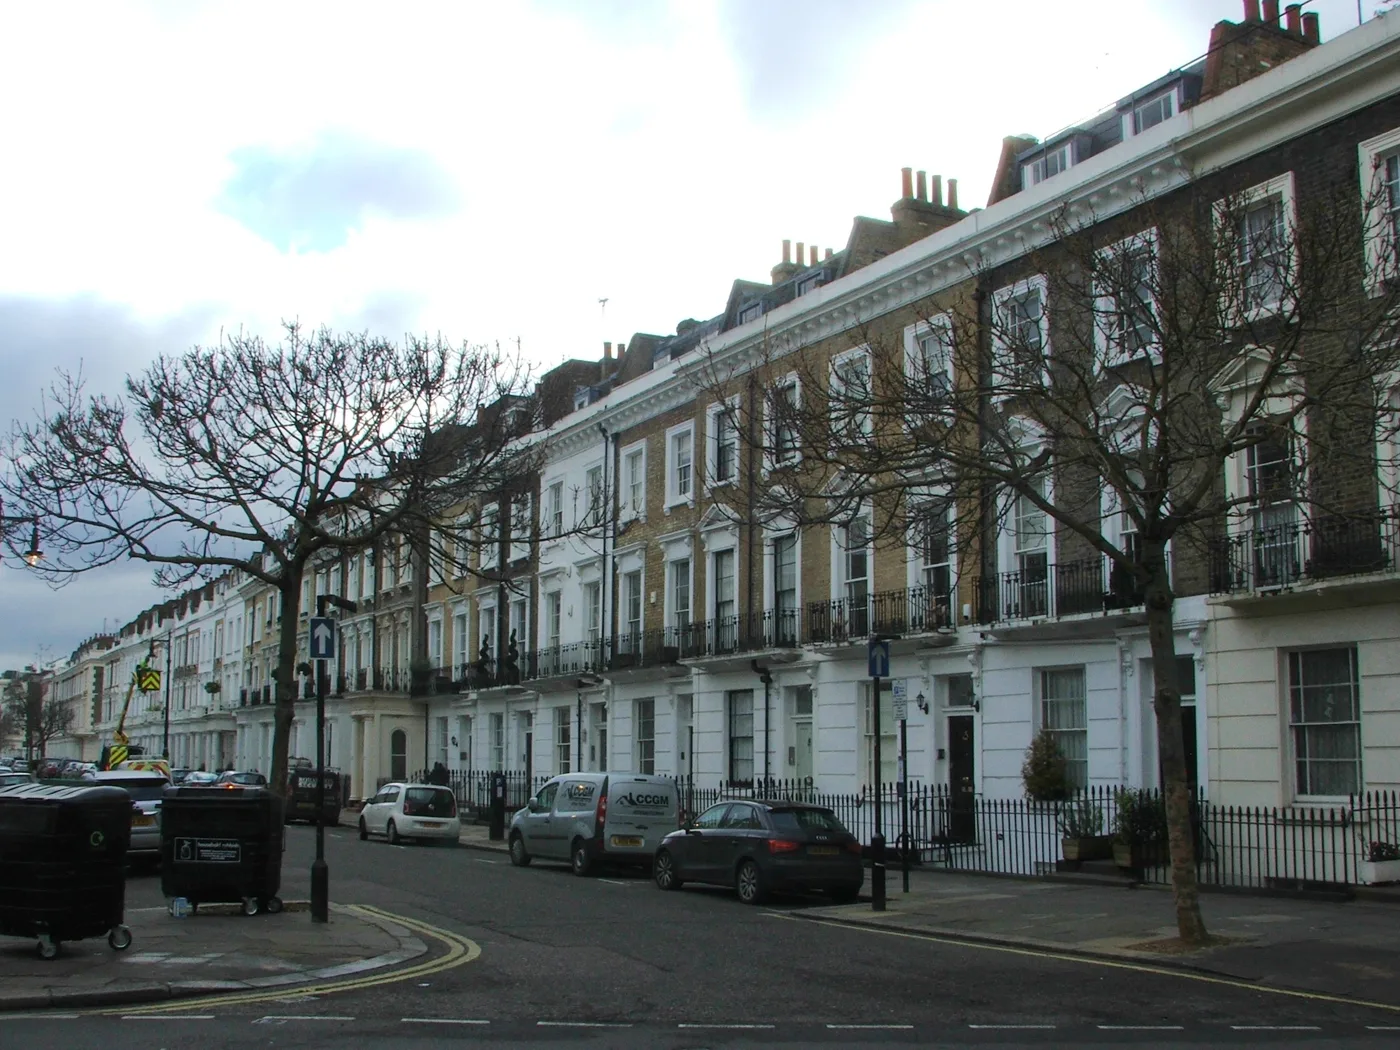

The average Westminster home sold for £836,331 in May 2026, down 22.8% in a year. The typical sale was £805,000 and 86% were flats. Postcode by postcode.
Westminster’s headline house price fell by nearly a quarter in a single year. That is not a crash in the sense most people mean it. It is what happens when a borough sells fewer than a hundred homes a month and a handful of them are worth more than everything else put together. Read the average on its own and you will draw the wrong conclusion about Maida Vale or Pimlico.
This page uses two official sources and keeps them apart. The UK House Price Index gives the borough average, built from completed HM Land Registry sales. The Land Registry’s own Price Paid record gives every individual sale the registry files under the City of Westminster, which is the only way to get an honest figure for a postcode rather than the whole borough.
The headline figure
Update, 19 September 2026. The Land Registry has since revised May 2026 up to £861,415, a fall of 20.5% rather than 22.8%, and published figures to July 2026: an average of £876,788, down 20.7% on the year but up for the third month in a row. The figures below are the May release as we first published them. The newer numbers, and how Westminster compares with every other London borough, are in Westminster house prices fall 20.7%, the steepest in London.
The average home in the City of Westminster sold for £836,331 in May 2026, down 22.8% over the year. In the same month London as a whole was down 3.7% and England was up 2.3%.
The fall built through the year rather than arriving in one month. In May 2025 the borough average was £1,083,519 and still rising. By November it was £952,040 and down 7.1% on the year. By March 2026 it was £834,522 and down 12.3%. The annual figure then jumped to −18.8% in April and −22.8% in May, largely because the comparison months in 2025 were unusually strong.
What it means for you. If you own a flat in Maida Vale or Pimlico, your home has not lost a quarter of its value. What has changed is the mix and the volume of what sells at the top of the market, and that is what moves the borough average. If you are buying, the useful number is the one for your postcode and your property type, further down this page. If you are selling, the slowdown in transactions is the real signal: fewer than 100 completions a month across the whole of Westminster means a thin market and long timescales.
The typical sale is £805,000, not £836,331
The Land Registry filed 1,885 sales in the City of Westminster in the twelve months to 30 June 2026. The median of those, the one in the middle, was £805,000. The mean of the same set was £2,474,063, three times higher, because the set includes a £37 million sale in W1C and a run of eight-figure transactions in Mayfair and the West End.
Of those 1,885 sales, 1,720 were ordinary residential property types, and 1,472 of them, 86%, were flats. Westminster is a flat market with a very expensive tail attached.
| Property type | Sales | Median price |
|---|---|---|
| Flat or maisonette | 1,472 | £700,000 |
| Terraced house | 218 | £2,100,000 |
| Semi-detached house | 18 | £4,487,500 |
| Detached house | 12 | £2,975,000 |
| Other (largely commercial and mixed use) | 165 | £2,000,000 |
| All sales | 1,885 | £805,000 |
Thirty sales in a year were semi-detached or detached houses. Treat those two rows as curiosities rather than a market. The row that describes Westminster as most people buy it is the flat at £700,000.
Only 18 of the 1,885 sales were new build, at a median of £3,775,000. New housing in this borough is a luxury product and a small one.
Postcode by postcode
This is where the borough average stops being useful. Every figure below is the median of the flats the Land Registry recorded in that postcode district over the same twelve months, so it compares like with like.
Two results are worth pulling out.
The volume is in the west and the south, not the centre. W9 Maida Vale recorded 314 flat sales and W2 Paddington and Bayswater 295, between them a third of every flat sold in the borough. Their medians, £638,333 and £623,000, are within £20,000 of each other. SW1V Pimlico is a third large market at £620,000.
W10 Queen’s Park is the one part of Westminster that is mostly houses. Of its 40 recorded sales, 31 were terraced houses at a median of £950,000 and only nine were flats, at a median of £460,000. That £460,000 is the cheapest flat figure of any Westminster postcode, and it does not appear in the chart above because nine sales is too few to read as a market.
The cheapest and priciest streets
These are streets with at least eight recorded sales in the twelve months, so they are patterns rather than one-off transactions.
| Street | Sales | Median |
|---|---|---|
| George Street, Marylebone | 15 | £3,850,000 |
| Circus Road, St John's Wood | 11 | £2,370,000 |
| Warrington Crescent, Maida Vale | 9 | £1,250,000 |
| Victoria Street, Westminster | 11 | £1,000,000 |
| Hyde Park Square, Bayswater | 12 | £937,500 |
| Shirland Road, Maida Vale | 23 | £505,000 |
| Harrow Road | 14 | £483,750 |
| Abbey Road, St John's Wood | 20 | £450,000 |
| Churchill Gardens, Pimlico | 20 | £410,000 |
| Edgware Road | 23 | £395,000 |
Abbey Road at a £450,000 median is the clearest illustration of why street names mislead. It is one of the best known addresses in London, and the flats that actually change hands on it are small ones at the Kilburn end. Edgware Road and Churchill Gardens are the two busiest streets in the borough for sales and the two cheapest, both around £400,000.
Prices by property type, and buyer type
These are the borough-wide averages from the UK House Price Index for May 2026. They are means, so they run well above the medians above, but the annual change columns are the useful part.
| Category | Average price | Change over 12 months |
|---|---|---|
| Flat or maisonette | £743,345 | −23.1% |
| Terraced house | £1,503,393 | −20.8% |
| Semi-detached house | £2,444,967 | −23.0% |
| Detached house | £3,574,868 | −20.3% |
| First-time buyer | £752,768 | −22.6% |
| Home mover | £991,098 | −22.5% |
| All types | £836,331 | −22.8% |
Every category fell by roughly the same amount, between 20% and 23%. That uniformity is itself a clue: a genuine market shift usually hits flats harder than houses, or first-time buyers harder than movers. A fall this even across every category is what an index does when the volume underneath it is thin.
How Westminster compares
| Area | Average price | Change over 12 months |
|---|---|---|
| City of Westminster | £836,331 | −22.8% |
| London | £544,814 | −3.7% |
| England | £292,095 | +2.3% |
A Westminster home still costs about £290,000 more than the London average and almost three times the England average, even after the fall.
Three traps in Westminster price figures
The mean and the median are a million pounds apart. Any “average Westminster house price” between about £800,000 and £2.5 million can be defended with real data. Always check whether you are being shown a mean or a median, and over what period.
Most of the postcodes are shared. Of the districts in the chart above, only W1H and W1U sit wholly inside Westminster. W2, W9, NW8, NW1 and W10 all run into Camden, Brent, Kensington and Chelsea or Ealing. A price quoted for “NW8” or “W2” includes sales in a different borough, which matters if you are checking which council you will pay or looking up a planning history. Every figure on this page is filtered on the district the Land Registry itself records, so it is Westminster sales only.
The commercial core barely trades in homes. W1B, W1D, W1F, W1S, WC2E, WC2H and WC2R together produced fewer than 80 recorded sales in a year, and a large share of those are offices and shops filed as “other”. Do not read a residential market into a West End postcode.
Frequently asked questions
What is the average house price in Westminster?
£836,331 in May 2026, according to the UK House Price Index, down 22.8% over the year. The typical, or median, sale in the twelve months to June 2026 was lower, at £805,000.
Are Westminster house prices falling?
The index says yes, by 22.8% in the year to May 2026, against a London fall of 3.7%. Some of that is a real cooling in prime central London, and some is arithmetic: with fewer than 100 sales a month, a quieter year at the top end pulls the average down sharply without every home losing value.
How much is a flat in Westminster?
The median flat sold for £700,000 in the twelve months to June 2026. By postcode that ranges from about £620,000 in Pimlico, Paddington and Maida Vale to £2,975,000 in Mayfair.
What is the cheapest part of Westminster to buy in?
On recorded sales, the streets around Harrow Road and Shirland Road in W9, and the Churchill Gardens estate in Pimlico. Churchill Gardens had a median of £410,000 across 20 sales and Edgware Road £395,000 across 23.
How many homes sell in Westminster each year?
1,885 in the twelve months to 30 June 2026, of which 1,720 were standard residential types and 1,472 were flats. That is a small market for a borough of this size, and it is why the averages swing.
Where can I check what a specific flat sold for?
Every completed sale in England and Wales is public. Look up a street or a single address free on the HM Land Registry Price Paid service.
Related
- Westminster planning news: how many new homes the borough is meant to build, and who now decides applications on Oxford Street.
- Westminster Tube and train times: the fares and journey times behind those postcode differences.
- Things to do in Westminster: what you get for the money.
- Westminster roadworks and travel: parking zones, the congestion charge and what is dug up right now.
Sources
- UK House Price Index, City of Westminster (ONS and HM Land Registry) for the borough average, property-type, buyer-type and comparison figures, and for the monthly series. Retrieved from the Land Registry linked-data service on 9 August 2026.
- HM Land Registry Price Paid linked data for the 1,885 individual sales, queried on the City of Westminster district for 1 July 2025 to 30 June 2026 and retrieved on 9 August 2026. Medians by property type, postcode district and street are calculated from that set.
- HM Land Registry Price Paid search to check an individual address.
Land Registry figures are provisional and revised as more sales complete. Check the latest numbers against the linked sources before you rely on them.
Have your say