
The average Westminster home fell 14.3% in a year to £887,206 in August, London's second-steepest fall. July has been revised up by £15,373.
The average home in the City of Westminster sold for £887,206 in August 2026. That is £148,015 less than a year earlier, a fall of 14.3%.
The figures come from the Land Registry’s UK House Price Index for August, published this week. Only the City of London fell further. London as a whole was down 2.2%, and England was up 0.4%.
The annual fall is much smaller than the 20.7% we reported for July. That is not because prices recovered in August. They slipped 0.6% on the month. The difference comes from last year: August 2025 was itself a weak month, so this year’s figure is being measured against a lower starting point.
The quick answer
- Average price, August 2026: £887,206, down 14.3% on August 2025.
- On the month: down 0.6%, the second small monthly fall in a row.
- In London: the second-steepest annual fall of 33 areas, behind the City of London (down 14.6%).
- Flats: £784,694, down 15.1%. Flats are most of what sells in Westminster.
- July revised: now £892,161 and down 19.4%, not £876,788 and down 20.7%.
Second only to the City of London
The index covers all 32 London boroughs plus the City of London. In August, 22 of those 33 areas were worth less than a year earlier, nine were worth more and two were flat.
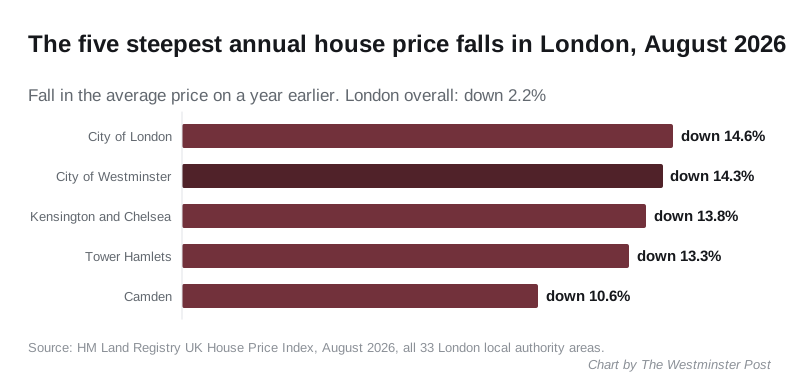
| Area | Average price, August 2026 | Annual change |
|---|---|---|
| City of London | £726,633 | down 14.6% |
| City of Westminster | £887,206 | down 14.3% |
| Kensington and Chelsea | £1,204,072 | down 13.8% |
| Tower Hamlets | £447,950 | down 13.3% |
| Camden | £798,486 | down 10.6% |
| London | £554,430 | down 2.2% |
| England | £293,525 | up 0.4% |
All five steep falls are central, high-value markets dominated by flats. The biggest rises were on the edges of London: Kingston upon Thames up 4.9% and Barking and Dagenham up 4.7%.
Kensington and Chelsea, at £1,204,072, is still the only London area dearer than Westminster.
Two months of small falls
The monthly figures tell a gentler story than the annual one. Westminster’s average hit its low for the year in April, at £868,489. It rose 1.6% in May and 1.3% in June, then slipped 0.3% in July and 0.6% in August.
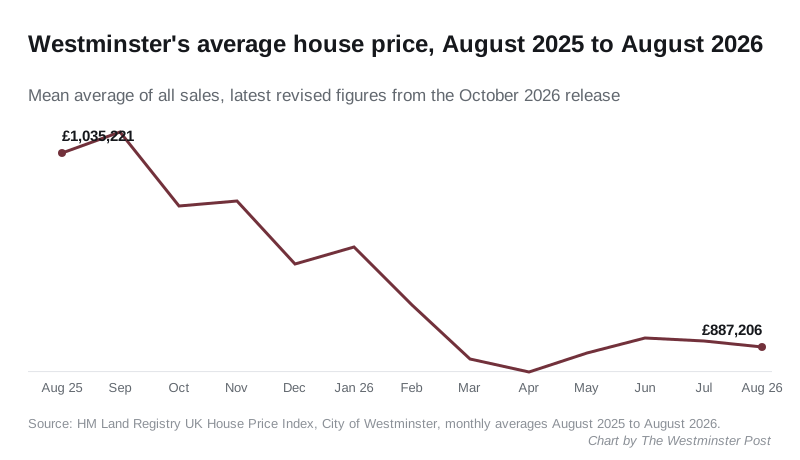
| Month | Average price | Change on the month |
|---|---|---|
| August 2025 | £1,035,221 | down 6.4% |
| September 2025 | £1,051,596 | up 1.6% |
| December 2025 | £950,271 | down 4.8% |
| March 2026 | £878,055 | down 4.5% |
| April 2026 | £868,489 | down 1.1% |
| May 2026 | £882,764 | up 1.6% |
| June 2026 | £894,417 | up 1.3% |
| July 2026 | £892,161 | down 0.3% |
| August 2026 | £887,206 | down 0.6% |
The May row shows how much these numbers move. Last month’s release put May at £861,415. This month’s puts it at £882,764.
July has been revised up
The Land Registry revises recent months as more sales are registered. Westminster’s latest revisions are large:
- July: first published at £876,788, now £892,161, a rise of £15,373.
- July’s annual fall: first 20.7%, now 19.4%.
- July on the month: first published as a rise of 1.1%, now a fall of 0.3%.
That changes one point in our July story, which said prices had risen for three months in a row. On the revised figures they rose for two, May and June. We have added a note to that story.
Revisions this size happen in Westminster because it sells few homes and many of them are very expensive. A handful of late-registered sales can move the average by thousands of pounds. Treat the August figure as provisional too.
Flats fell furthest
| Property type | Average price | Annual change |
|---|---|---|
| Detached | £3,935,497 | down 6.8% |
| Semi-detached | £2,810,593 | down 4.1% |
| Terraced | £1,641,592 | down 9.6% |
| Flat or maisonette | £784,694 | down 15.1% |
Source: UK House Price Index, August 2026.
Flats matter most here because they are most of the market. Houses are rare in Westminster, so their averages rest on very few sales.
First-time buyers and cash buyers
The first-time buyer average was £791,770, down 14.6% on a year earlier.
Cash buyers paid more than buyers with a mortgage. The average cash purchase was £918,169, against £867,420 with a mortgage. Both were down about 14% on the year.
What it means for you
- If you are selling, the borough average is no guide to your home. It is a mean, so a few very expensive sales pull it up or down. Look at recent sales on your own street on our house prices page, which goes postcode by postcode.
- If you are buying a flat, prices are down about 15% on a year ago, but they have been broadly level since spring.
- If you are watching the trend, wait for revisions. The latest two months usually move when the next release comes out.
- Council tax does not change with prices. Bands still rest on 1991 values: see our council tax bands page.
About these figures
The UK House Price Index is published monthly by HM Land Registry with the Office for National Statistics. It is a mean average, not a median: the total value of sales divided by the number of them. It is also adjusted for the mix of property types sold. The September figures are due in November.
Have your say