
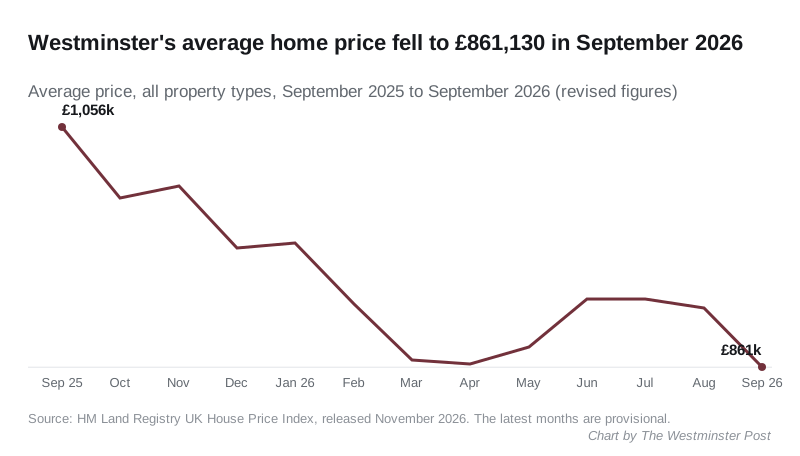
The average Westminster home fell 18.5% in a year to £861,130 in September, the steepest fall in London. It is the lowest average since August 2013.
The average home in the City of Westminster sold for £861,130 in September 2026. That is 18.5% less than a year earlier, the steepest annual fall of any area in London.
It is also the lowest average the borough has recorded since August 2013.
The figures come from the Land Registry’s UK House Price Index for September, published this week. London as a whole was down 3.5% on the year. England was up 0.8%.
Overview
- Average price, September 2026: £861,130, down 18.5% on September 2025 (£1,056,370).
- On the month: down 5.3%, or £47,856, from a revised £908,986 in August.
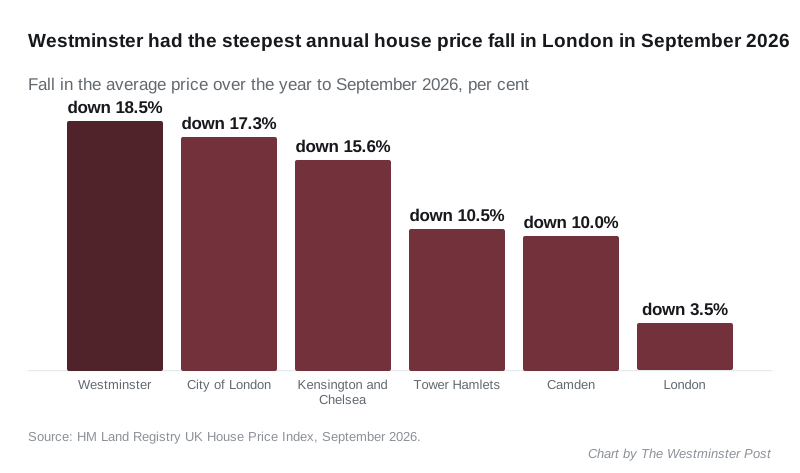
- In London: the steepest annual fall of 33 areas, ahead of the City of London (down 17.3%) and Kensington and Chelsea (down 15.6%).
- Lowest since: August 2013. The peak was £1,224,972 in January 2023.
- August revised up: now £908,986 and down 12.2%, not £887,206 and down 14.3%.
- Treat it as provisional. Westminster’s first figures for May, July and August have all since been revised up.
A sharp fall in one month
Most of the September drop happened in a single month. The average fell 5.3% from August, the borough’s biggest monthly fall since October 2025.
Westminster has had several months like this in the past year. The index shows falls of 5% or more in October 2025, December 2025, February 2026 and March 2026. In between, the average held steady or rose. June’s 4.5% rise was the largest of them.
| Month | Average price | Change on the month |
|---|---|---|
| September 2025 | £1,056,370 | up 2.0% |
| October 2025 | £998,534 | down 5.5% |
| December 2025 | £958,169 | down 5.0% |
| February 2026 | £912,317 | down 5.2% |
| March 2026 | £866,969 | down 5.0% |
| April 2026 | £864,118 | down 0.3% |
| June 2026 | £916,910 | up 4.5% |
| July 2026 | £916,428 | down 0.1% |
| August 2026 | £908,986 | down 0.8% |
| September 2026 | £861,130 | down 5.3% |
Source: HM Land Registry UK House Price Index, figures as revised in the September 2026 release.
From the January 2023 peak of £1,224,972, the average is now down £363,842, or about 30%.
Steepest in London
In August Westminster had the second-steepest fall in London, behind the City of London. In September it moved to the top of the table.
| Area | Average price, September 2026 | Annual change |
|---|---|---|
| City of Westminster | £861,130 | down 18.5% |
| City of London | £663,585 | down 17.3% |
| Kensington and Chelsea | £1,170,938 | down 15.6% |
| Tower Hamlets | £456,306 | down 10.5% |
| Camden | £789,180 | down 10.0% |
| London | £545,579 | down 3.5% |
| England | £292,998 | up 0.8% |
The pattern is the same as in previous months. The steepest falls are all in central, expensive areas where most homes sold are flats. On the edges of London prices are rising, led by Barking and Dagenham, up 5.1%.
Kensington and Chelsea, at £1,170,938, is still the only London area where the average home costs more than in Westminster.
August has been revised up
The Land Registry revises recent months as late sales are registered. In Westminster, the revisions keep going one way:
- August: first published at £887,206, now £908,986, up £21,780.
- August’s annual fall: first 14.3%, now 12.2%.
- July: first published at £876,788, then £892,161, now £916,428.
We have added a note to our August story.
So the September figure may well rise when October’s numbers come out. Even so, it would need a revision of about £48,000 to get back above August.
Flats fell furthest
| Property type | Average price | Annual change |
|---|---|---|
| Detached | £3,741,702 | down 12.6% |
| Semi-detached | £2,631,290 | down 12.1% |
| Terraced | £1,578,431 | down 15.1% |
| Flat or maisonette | £763,128 | down 19.0% |
Source: UK House Price Index, September 2026.
Flats are most of what sells in Westminster. The flat average is also the lowest since 2013.
First-time buyers and cash buyers
The first-time buyer average was £768,186, down 18.9% on a year earlier.
The fall was much the same for every kind of buyer:
- cash buyers: £891,259, down 18.2%
- buyers with a mortgage: £841,894, down 18.7%
- people who already owned a home: £1,024,599, down 18.0%
What it means for you
- If you are selling, the borough average says little about your home. It is a mean, and the index counted between 109 and 145 Westminster sales a month from January to July, so a few very expensive sales move it a long way. Recent sales near you are on our Westminster house prices page, postcode by postcode.
- If you are buying a flat, the index puts the average flat at £763,128, about a fifth below a year ago.
- If you are watching the trend, wait a month. The first figures for May, July and August have all since been revised up.
About these figures
The UK House Price Index is published monthly by HM Land Registry with the Office for National Statistics. It is a mean average, not a median: the total value of sales divided by the number of them, adjusted for the mix of property types sold. The October figures are due in December.
Have your say