
Westminster's claimant count rose by 155 to 6,335 in October, yet that is 95 fewer than a year ago. London and the UK both rose over the same 12 months.
Overview
6,335 people in Westminster were claiming unemployment-related benefits in October. That is 155 more than in September and 95 fewer than in October 2025. The rate is 4.0% of residents aged 16 to 64, against 5.6% across London.
The Office for National Statistics published the figures today. (ONS claimant count via nomis)
Down on the year while London rises
Westminster is one of 12 London boroughs with fewer claimants than a year ago. Over the past 12 months:
- Westminster: down 95, from 6,430 to 6,335 (1.5%)
- London: up 2,105, from 348,915 to 351,020
- United Kingdom: up 57,100, from 1,650,220 to 1,707,320
Islington had the biggest fall in London, at 5.1%. Sutton had the biggest rise, at 6.3%.
The monthly rise is worth watching, though. October’s 155 increase is the largest one-month rise in Westminster since February 2025. The borough’s count stood at 6,625 in October 2024 and peaked at 6,920 in February 2025. It then drifted down to 6,150 in August this year, its lowest point in the past two years.
Four wards in the north-west hold more than a third
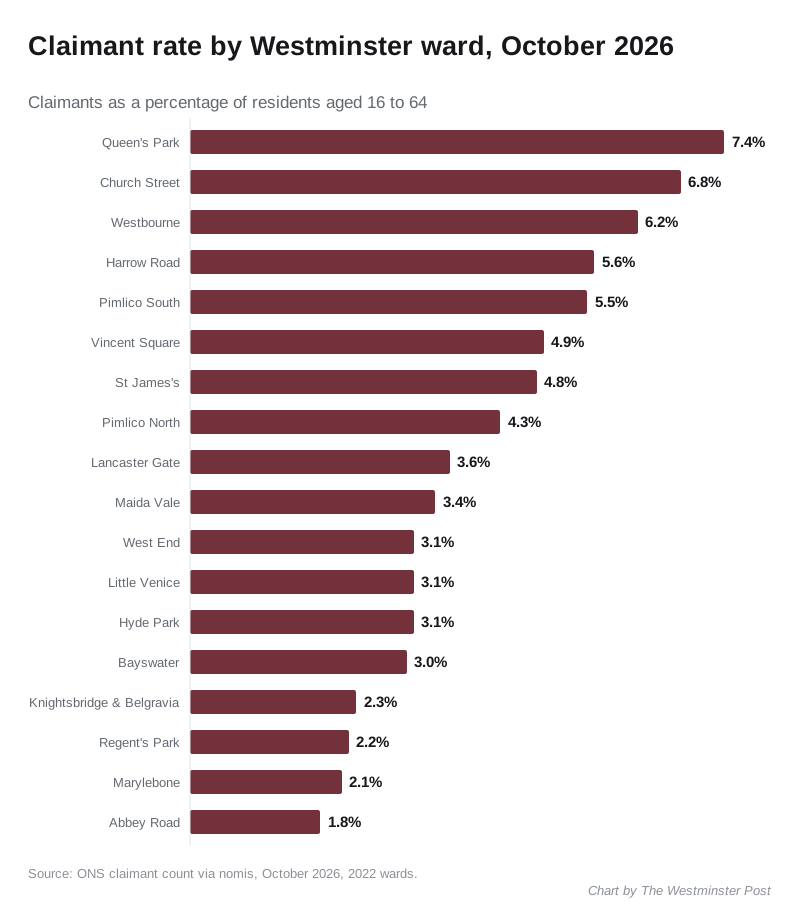
The ONS publishes ward figures on the same day. Four wards account for 2,295 of the borough’s 6,335 claimants, or 36%:
| Ward | Claimants | Share of 16 to 64s |
|---|---|---|
| Queen’s Park | 665 | 7.4% |
| Church Street | 590 | 6.8% |
| Westbourne | 545 | 6.2% |
| Harrow Road | 495 | 5.6% |
| Pimlico South | 405 | 5.5% |
| Vincent Square | 385 | 4.9% |
| St James’s | 435 | 4.8% |
| Pimlico North | 345 | 4.3% |
| Lancaster Gate | 310 | 3.6% |
| Maida Vale | 310 | 3.4% |
| West End | 305 | 3.1% |
| Little Venice | 250 | 3.1% |
| Hyde Park | 270 | 3.1% |
| Bayswater | 270 | 3.0% |
| Knightsbridge and Belgravia | 190 | 2.3% |
| Regent’s Park | 200 | 2.2% |
| Marylebone | 195 | 2.1% |
| Abbey Road | 170 | 1.8% |
The rate in Queen’s Park is four times the rate in Abbey Road, in St John’s Wood. Pimlico South is the highest of the southern wards, at 5.5%.
Who is claiming
The age split in October:
- 18 to 24: 810, the same as a year ago
- 25 to 49: 3,655, down from 3,760
- 50 and over: 1,870, up from 1,855
So the fall over the year comes from people aged 25 to 49. The number of young claimants has not moved. (ONS claimant count via nomis)
What it means for you
The claimant count is not the unemployment rate. It counts people on Jobseeker’s Allowance and people on Universal Credit who are required to look for work. That includes some people already in work on low pay.
The figures are not seasonally adjusted, so it is fairer to compare October with October than with September. The ONS rounds every figure to the nearest five. It also revises the latest month when the next release comes out, so October’s total may move slightly in December.
Have your say