
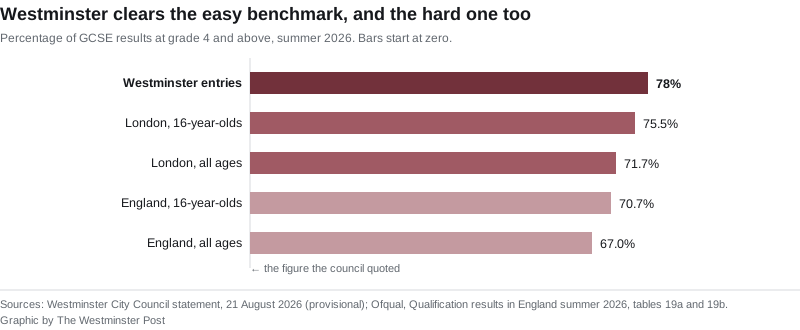
Westminster reports 78% of GCSE entries at grade 4 or above, clearing England's 67% and London's tougher 16-year-old rate of 75.5%. One claim cannot be checked.
Westminster’s GCSE candidates got 78% of their entries to grade 4 or above this summer, the council said the day after results were issued. That is comfortably above the national figure it chose to compare itself with. It is also above the much harder benchmark it did not mention.
The council published its provisional figures on 21 August, a day after results went out on Thursday 20 August. (Westminster City Council)
What it reported:
- 78% of entries at grades 9 to 4, against “the national average of 67%”
- 65% of entries at grades 9 to 5, against “52% nationally”
- In English and maths, 74% at grades 9 to 4 and 59% at grades 9 to 5
Cllr Hannah Galley, cabinet member for children and education, said students “should be incredibly proud of the results they have achieved”. Numera Anwar, principal at Westminster Academy on the Harrow Road, said the school had “achieved our strongest performance in the highest grades for some time”.
The 67% is the softest test there is
The 67.0% figure is real. It comes from Ofqual’s summer 2026 data tables, table 19a, and it is the percentage of GCSE results awarded at grade 4 or above in England across all ages. (Ofqual, Qualification results in England summer 2026)
The problem is what “all ages” contains. Ofqual’s table 16 shows that 265,825 students, 25.4% of everyone who received a GCSE result this summer, sat exactly one GCSE. Among 16-year-olds the figure is 1.4%. Those quarter of a million single-entry candidates are overwhelmingly resitting English or maths at a college, and their pass rates are far lower: table 20 puts further education establishments at 17.6% and sixth form colleges at 32.2% at grade 4 and above.
None of that is in a Westminster secondary school’s Year 11 cohort. Comparing a school-age cohort with the all-ages number flatters every council in the country by several points.
Ofqual publishes three fairer comparators in the same release, and Westminster is above all of them.
| Benchmark | Grade 4 and above | Grade 7 and above |
|---|---|---|
| England, all ages (the council's comparator) | 67.0% | 21.8% |
| England, 16-year-olds only | 70.7% | 23.1% |
| London, all ages | 71.7% | 28.6% |
| London, 16-year-olds only | 75.5% | 30.2% |
London’s 16-year-old rate of 75.5% is the honest test of a London borough, and it is the highest of any English region on both measures. Westminster’s 78% clears it by about two and a half points. On the council’s own benchmark the lead looks like eleven points; on the one that actually matches the cohort it is closer to two. It is still a lead, and it is a real one.
The 52% comparison cannot be checked
The council’s second claim, 65% of entries at grades 9 to 5 against “52% nationally”, has no published source behind it.
Ofqual’s data tables report GCSE outcomes at grade 7 and above and grade 4 and above only. There is no grade 5 and above percentage anywhere in the release, for England, for any region, or for any centre type. We parsed the full workbook to check.
So the 52% is not a figure a reader can verify, and neither is the gap. We are not saying it is wrong. We are saying the council has not said where it comes from, and the official statistics do not contain it. The same gap appeared on A level results day, where the borough’s 67% at grades A* to B had no national column to sit against either.
English and maths: the one measure with a history
The English and maths figures are the interesting ones, because a comparable series exists for them.
The Department for Education publishes the percentage of pupils reaching grade 4 or above in both English and maths, per pupil rather than per entry, for every local authority. The most recent edition covers 2024/25 and was published in April 2026. The next one is due in October 2026, so there is no national figure for this summer yet.
Westminster on that measure:
| Year | Westminster | Inner London | England |
|---|---|---|---|
| 2022/23 | 76.0% | 69.7% | 65.1% |
| 2023/24 | 77.0% | 70.7% | 65.0% |
| 2024/25 | 74.2% | 69.3% | 64.8% |
Westminster is well clear of both. In 2024/25 the borough ranked 9th of the 32 London boroughs and 15th of the 152 English local authorities on this measure, from a cohort of 1,784 pupils at the end of key stage 4. Its average Attainment 8 score, 53.2, was more than seven points above England’s 46.0.
But the borough’s own trend went the other way. It held 76% and then 77%, and then dropped 2.8 points to 74.2% in 2024/25.
The council has not said which basis this year’s 74% and 59% are calculated on. If they are the same per-pupil measure, this summer is essentially flat on last year rather than a recovery. If they are per entry, they are not comparable with the DfE series at all. Either way, the release does not tell you, and “above the most recently published national outcomes” is true on any reading, because England has been at roughly 65% for three years.
Why you cannot rank the borough’s schools against this
Individual schools will publish their own headline percentages over the next fortnight, and those numbers will not be comparable with each other or with anything above.
Some schools report the percentage of grades, some the percentage of students, some quote “English and maths together” and some fold in vocational equivalents. Westminster also has a large independent sector sitting in the same postcodes as its state schools, and Ofqual’s table 20 shows why that matters: independent schools nationally reached 88.4% at grade 4 and above this summer, against 68.2% for academies and 68.6% for local authority comprehensives.
A borough figure and a school figure are answers to different questions. Neither is a league table.
What it means for you
If a grade looks wrong, there is a process and a deadline.
- A clerical re-check and a review of marking both close on 24 September 2026. The re-check is returned within 10 calendar days of the board receiving it, the review within 20.
- The priority review service does not cover GCSE. It is A level, AS and level 3 vocational only, so there is no faster route for a GCSE grade.
- The request goes through the school, not the student or the parent. Only the head of centre can submit it, and it needs the student’s written consent.
- Grades can go down as well as up. There is no grade protection on a review, and that is the single thing families most often do not know.
The full rules are on the JCQ post-results services page.
Students still deciding what comes next can use Westminster’s Family Information Service and its Youth Hubs, both linked from the council’s results day statement.
Related
- Westminster A level results 2026: 86% at A* to C, and the same benchmark problem a week earlier.
- Westminster planning news: what is being built across the borough.
- Things to do in Westminster: the rest of the summer holidays.
Sources
- Westminster City Council: GCSE Results Day, published 21 August 2026, for all Westminster figures and both quotations. The council describes them as provisional.
- Ofqual: Qualification results in England, summer 2026, data tables. Table 16 for the single-entry candidates, tables 19a and 19b for the England and London benchmarks, table 20 for centre types. Checked 22 August 2026.
- DfE: Key stage 4 performance, 2024/25 edition, via the DfE statistics API, for the three-year English and maths series, the borough and national rankings, the cohort size and the Attainment 8 scores.
- JCQ: post-results services for the 24 September deadlines, the turnaround times, who may request a review and the absence of grade protection.
Have your say